
Data Collection for Your Datastory
- Timeframe: 01/16 – 02/13
- Points: 100
Description
Perhaps you are aware that most software companies rely on collecting, organizing, processing, analyzing, and selling data about us and our activities. Even if you are aware of these practices, this class provides you with the opportunity to learn more about contemporary ideas and practices surrounding digital media and writing. Datafication represents one such idea, which involves the practice to use digital media and technologies to create and use user-data to make sense of and commodify users and their practices. Most collection and analytic practices and insights, however, are not shared with us as users and are commodified in unregulated ways, which have produced numerous social consequences and questionable ethics.1,2,3,4,5,6,7,8,9
To better prepare you as citizens and professionals, we will respond to this datafication with a project that challenges you to learn how digital media and data are intertwined, since businesses produce data sets as integral texts about our everyday communication activities. Accordingly, this first project involves collecting, organizing, and creating a set of data in Google Sheets for 5 days about your everyday digital media practices.
This data set is your first step to think more explicitly about how digital data and our digital media practices are closely linked, as well as about how such sets of data are a form of digital media too. Furthermore, your data set will serve as the inventive seed by which your datastory’s narrative grows. In particular, the analysis of your data will shape the direction, quality, and design of your next project: the data visualization.
The main aim of this data collection is NOT statistical insight nor applying quasi-experimental design strategies, but to explore, examine, and gain insight into your writing practices and how digital media and data permeate it. In doing so, we will try to understand how digital media performs and communicates much more than what we may have originally thought.
To guide us through this process, we will all share the following broader research question: How are our media practices linked with algorithmic audiences? From there, each of you must choose and refine a particular topic as a path to explore one of your own prominent, digital media practices. Some past projects included the following topics:
- Emotions felt as: Browsing Instagram feed, Texting
- News engagement, e.g., overall, on Twitter, or with news apps on mobile phone.
- Use of emojis
- How I use Spotify’s machine-learning suggestion features
- Netflix viewing habits
Please note that these are but previous examples that may or may not suit your lifestyle. For a successful project, you need to consider projects that will enable you to collect at least ~10 observations per day. This will provide you with data for analysis.
General process
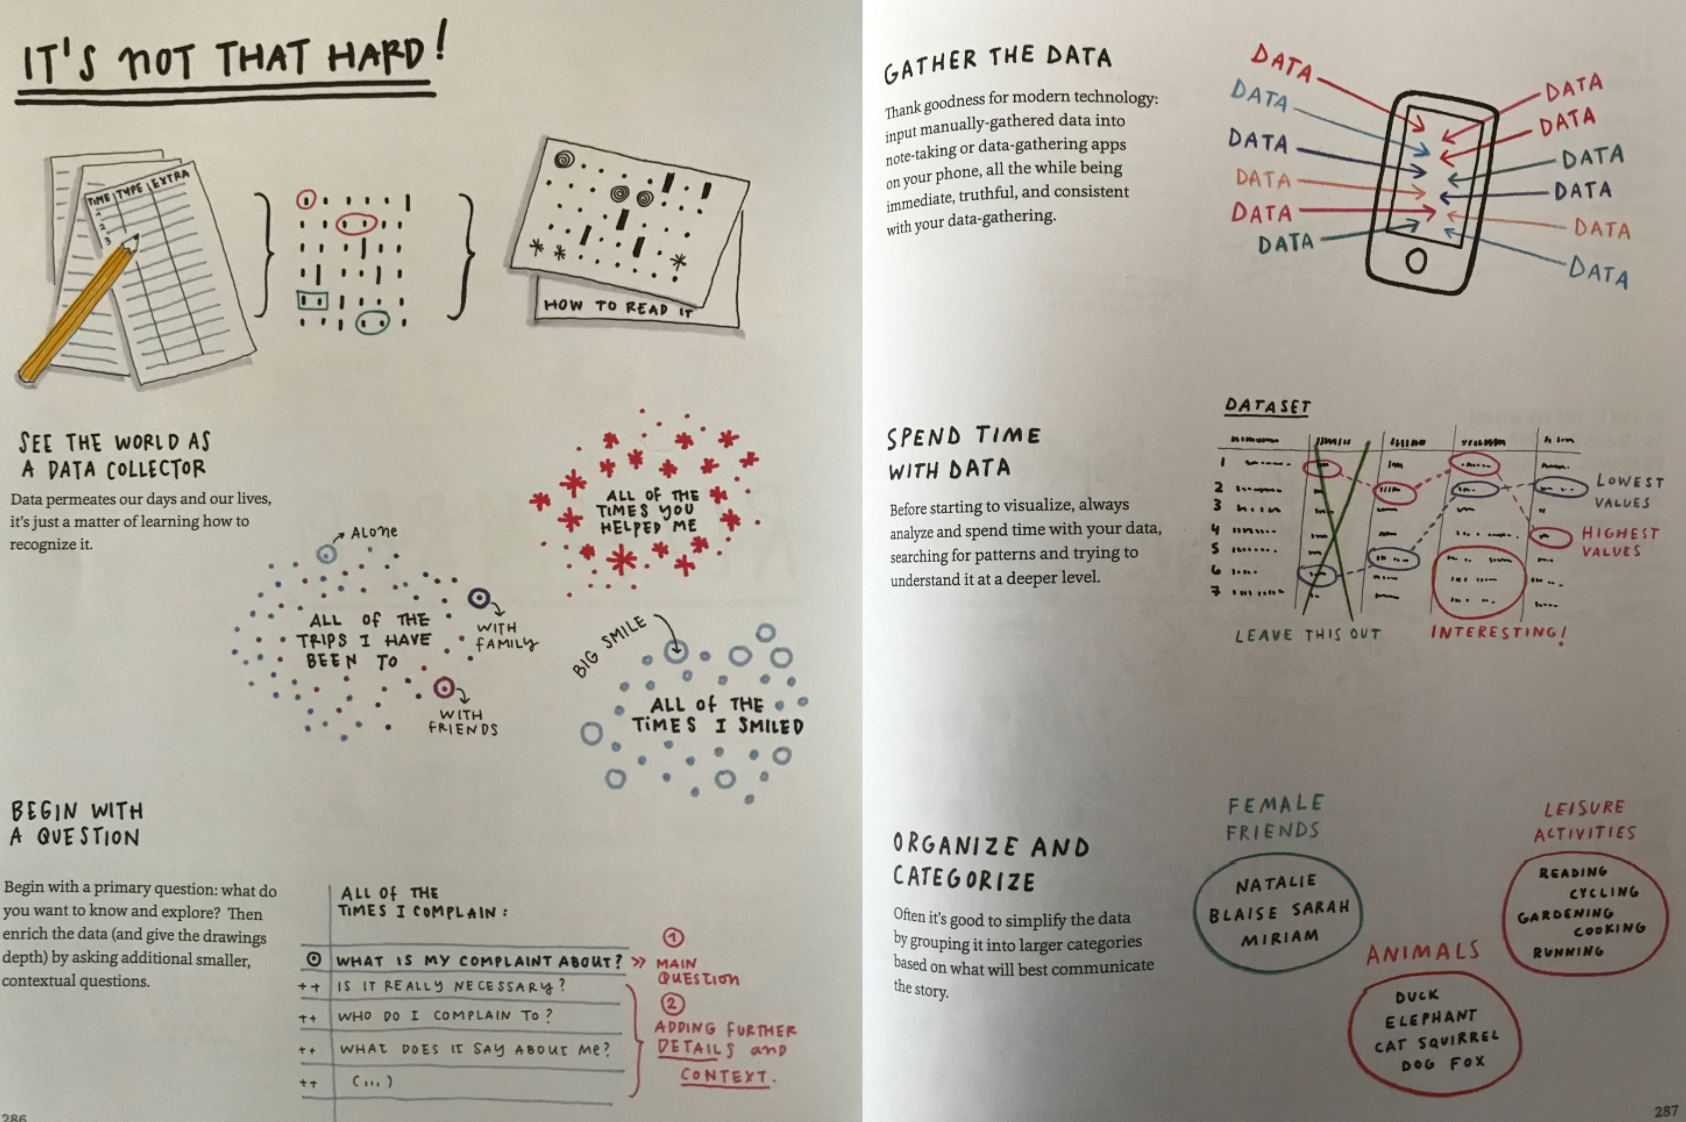
Like any good project, this one begins with a simple, personal felt dissonance—a provocation that cannot be ignored. From there, you will do the following to complete your data collection:
-
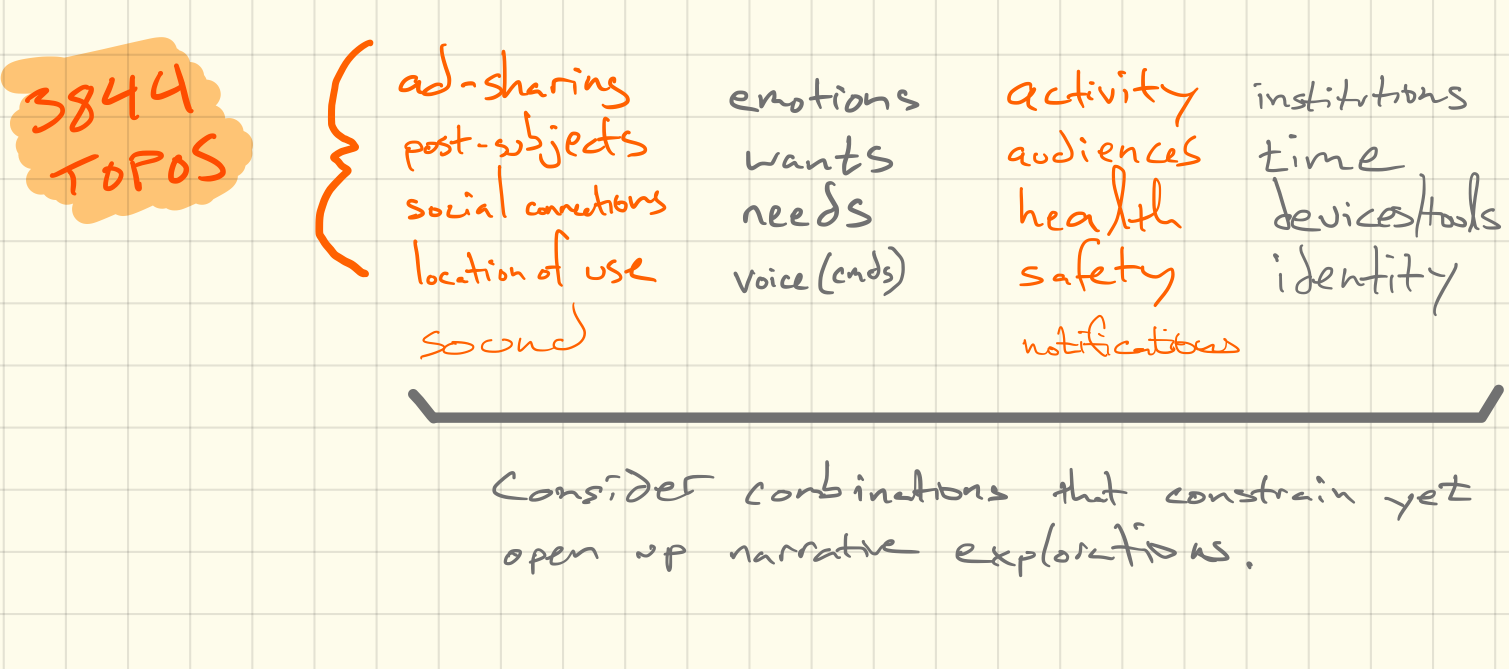
Consider & combine topos
Define the basic parameters of your study through an invention process that plays with topics of import.
-
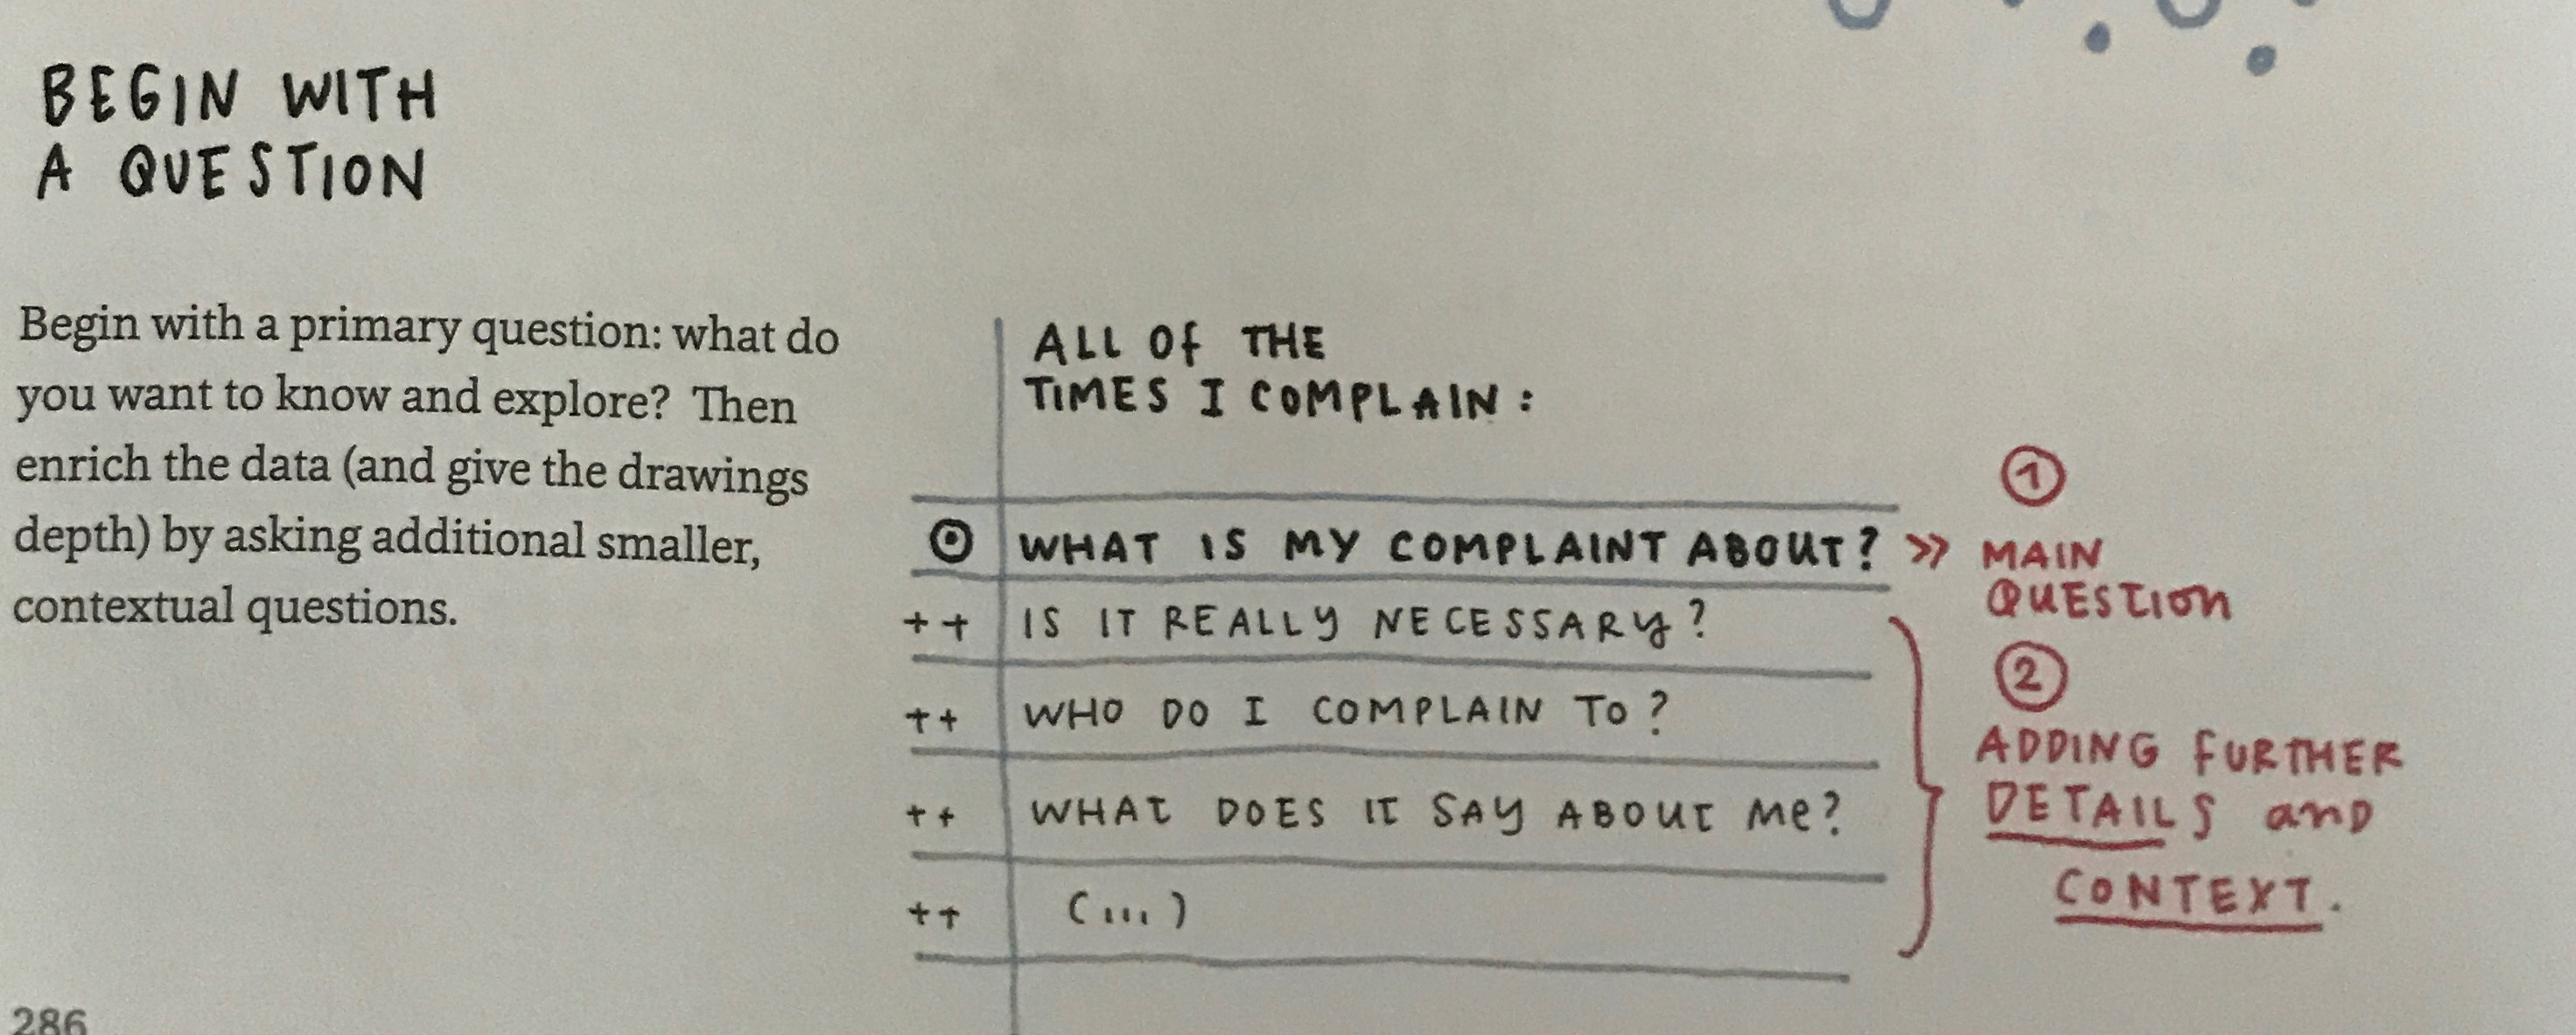
Distill your data-story topic as research question(s)
Refine the topical parameters of your study with a sharp set of questions.
-
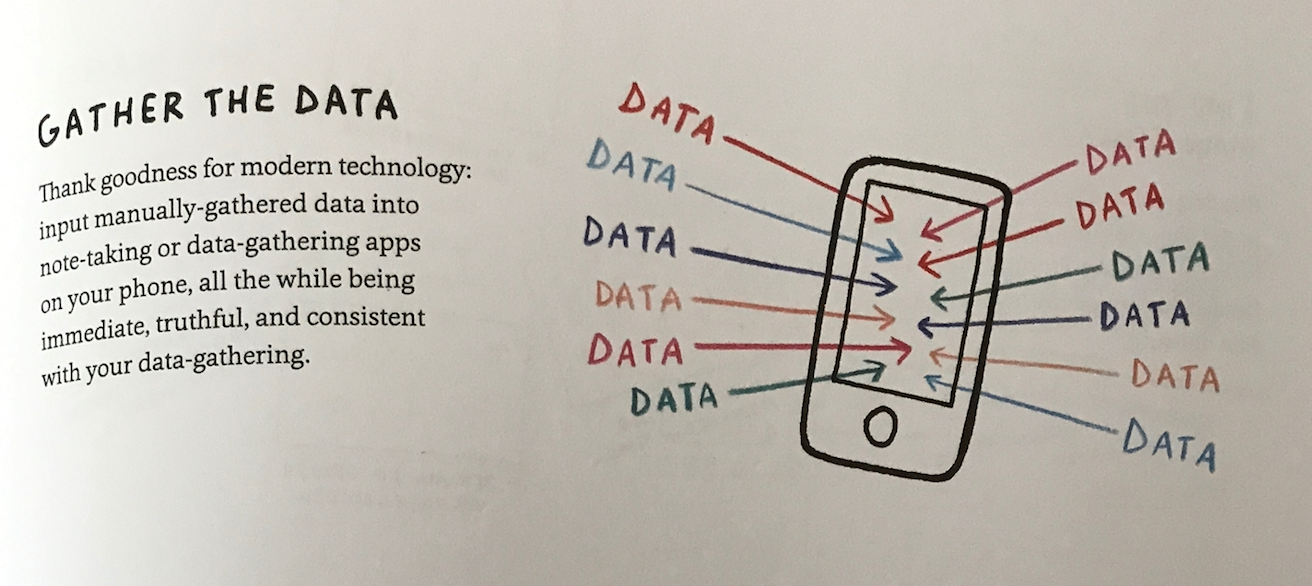
Plan data-collection strategies
Learn how to create a balance of well-planned and creative set of techniques.
-
Collect your data
Gather the data with your well-planned set of techniques, leaving room for creative hacks along the way!
Rubric
| Rubric Criteria | Points |
|---|---|
Data structure that follows basic tidy data guidelines:
| 50 |
| Data types: Demonstrates knowledge of nominal, ordinal, and categorical types of data, collecting a good mix of the 3 types. | 25 |
| Data integrity: If necessary, logs changes, modifications, and/or omissions with data collection. | 10 |
| If deemed important for future consideration, contextualize datapoints with notes about the moment. Data set should include at least 1 per day. | 10 |
| Consistently log your data in a Google Sheets spreadsheet every evening. | 5 |
| Total | 100 |